Google Analytics: The Basics

In the first of this series, we illustrated how to set up a Google Analytics account and link it to your website. If you missed it click here.
Assuming you have set it up and left it for a number of days to start tracking the data, this is a guide to the initial metrics and how they impact your website.
Google Analytics Data and Reports
Google Analytics provides reports with incredible insight into user behavior. Take a look at:
- How many people visited your site?
- How did they arrive at your website?
- How many new users visiting your website?
- How long are they visiting your site?
- How many pages did they view?
- If they found you via search engine, what words did they search for?
- What content is most popular on your website?
- Where are people leaving your website?
- If you have an eCommerce website, which products were purchased?
- If you use Google AdWords, how effective are your campaigns? Where can you make improvements?
What Do the Analytics Mean?
The very first thing to do is identify what date range you are viewing and the current report being displayed. In the “Reports” section of Google Analytics will generally default with the Audience: Overview page. The upper right corner shows the date range for the report that you will be viewing. The default is normally the last 30 days of analytics. If you want to be more granular you can choose any date range you find acceptable.
You will also notice a “Compare” radio button. This triggers a drop down of what period you would like to compare the current date range against. This is a great way to see how you are performing from month to month or year to year.
Each report has the ability to export as a .PDF or print for your own records.
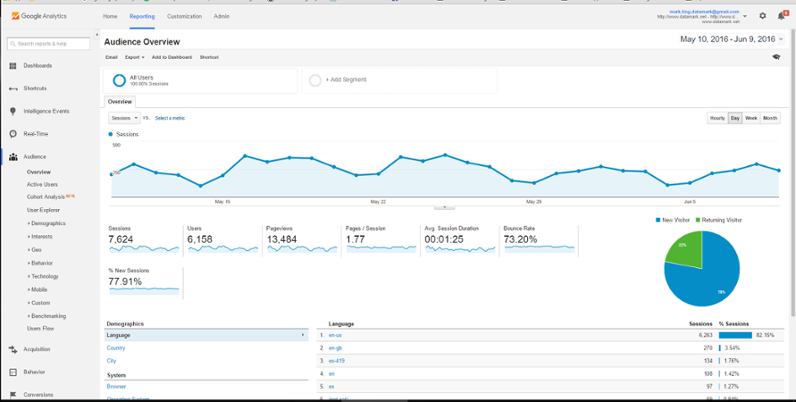
The first set of the report we will discuss are the default Overview in Audience:
Sessions: A session is each time a user is actively engaged with your website. This can be returning users that open a session with your website until they exit the site. This includes screen views, events, ecommerce, or even apps within your site.
Users: All users that have had at least one session within the selected date range. Includes both new and returning users.
Page views: Page views are the total number of pages viewed regardless of sessions. Repeated views of a single page are counted.
Pages /Session: These are the average pages viewed per session. This could be indicative of Average Page Depth. Repeated views of a single page are counted. This is a very important metric as it could show a content or website schematic problem.
Avg. Session Duration: This is the average length of time a user stays on your site per session. This metric can be illustrating a navigation issue or a content issue. Typically you want users to remain on your site for as long as it takes to convert into a customer.
Bounce Rate: Bounce Rate is the percentage of single-page visits. These are visits in which the person left your site from the entrance page without interacting with the page. This does not have to be the home page, it’s from the page they enter your site.
% New Sessions: This metric is critical for filling your pipeline in the sales funnel. If this is underperforming, this means the same users are coming to your site over and over again.
Go Beyond Just Web Metrics
Use the metrics to make informed data-driven decisions. Constantly evaluate:
- Bounce Rate: work to achieve 30% or lower…if more than 50%, then there is a content problem!
- Visitor to Lead Conversion Rate: should fall between 2 to 4%, if less than 2, there is a content problem!
- Lead to Sale Conversion Rate: if less than 8-10% there could be issues within your sales process
- Time to Convert Lead to Sale: compressing this ratio accelerates business cash flow
- Pages /Session: Depending on your website, you want to work towards an average of at least 2 pages per session. The lower this number could be a sign that the structure of the content is not easy to navigate or your content is to lean.
- Session Duration: Content must be relevant and easy to navigate. This could also be an indication that your website is taking too long to load. Think of this like you would if you have a store front, if someone walks in, turns around, and leaves quickly there may be a disconnect between your storefront and that potential customer.
- % New Sessions: This metric can indicate your site is hard to find or people are not finding it in search engines. It’s great to see returning visitors, but eventually these users move on, hopefully through converting into customers. To keep filling your pipeline with fresh prospects, this number should show a substantial part of your total visitors are new.
This is the 2nd in the series in Google Analytics: What Do They Mean
The 1st in the series: Website Checkup: Setting Up Google Analytics
Get started today!
Schedule your Intro Call with our team.